Monitoring Qwen 3 Agents with MLflow 3.x: End-to-End Tracing Tutorial
Enhance your multi-agent application's observability, explainability and Traceability

Let's face it - most multi-agent application tutorials online these days are toys. Running them doesn't reliably produce the expected results.
So in today's article, I'll walk you through in detail how we use MLflow's latest 3.1 version to trace and monitor agent applications developed based on Qwen 3 models in enterprise-level agent application development workflows. This will give you the ability to develop enterprise-grade high-reliability agent applications.
The complete project source code involved in this article is placed at the end of the article for your free reading and modification.
Introduction
As a data scientist with years of experience, before the AI era arrived, I had already developed many enterprise-grade algorithmic applications.
From my years of experience, measuring whether an algorithmic application is good to use doesn't just depend on whether the application uses the latest technology or has high evaluation metrics. The key is how to ensure that algorithmic applications can stably and reliably provide users with expected results. Namely, what we usually call observability, explainability, and traceability.
What do I mean?
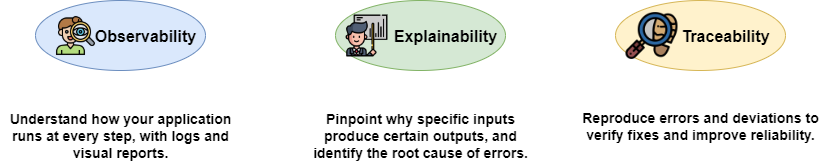
Observability: How does your application run at each step? Are there logs or visual reports to observe? Can developers or administrators monitor the running status at any time?
Explainability: For each step in the pipeline, can the algorithm explain why a certain input produced this result or caused an error?
Traceability: If errors occur during code execution or the obtained results deviate too much from expectations, can we accurately locate the cause of the problem and stably reproduce this error to confirm whether the issue is resolved?
After entering the AI agent era, with the emergence of numerous multi-agent development frameworks and increasingly higher levels of abstraction, engineers find developing new agent applications convenient. However, tracking and observing the effects during agent runtime becomes more difficult.
This leads to situations where we often don't know what the final prompt fed into the large language model is, why we didn't get the desired results, or how multiple agents are orchestrated during runtime.
Therefore, we urgently need a tool to help us observe and evaluate agent applications, ensuring we have full control over the entire agent operation process.
In the machine learning era, you should have used MLflow to track model training. Fortunately, MLflow recently launched version 3.0, adding tracking and evaluation capabilities for GenAI projects. Moreover, as an open-source project, it can meet data compliance requirements through self-hosted deployment.
So in today's article, I will explain in detail how to use MLflow 3.1 to track and monitor my multi-agent applications.
Why Should You Care?
In today's tutorial, I will guide you through the following content:
- How to install MLflow 3.1 and prepare for agent application tracking.
- Explain the usage of MLflow 3.1, including annotations, autolog, context manager, and how to handle situations like streaming output.
- Introduce MLflow's UI interface and basic concepts.
- How to use MLflow for tracking in Autogen agents and fix bugs in Autogen autolog.
- Use an Autogen GraphFlow project as an example to demonstrate how to use MLflow in multi-agent projects and record various information needed for tracking.
Through today's learning, you will save a lot of technical selection time and be able to proficiently use MLflow 3.x to track and monitor your multi-agents. Let's get started!
Prepare the MLflow Environment
Install MLflow Server
Installing MLflow is relatively simple. In your virtual environment, you can directly use pip to install:
pip install 'mlflow>=3.1'Since MLflow started focusing on tracking and evaluating GenAI apps from version 3.0, in my experience, version 3.1 has significant changes in API usage compared to version 3.0. To smoothly check the official website's API documentation and code examples, I recommend installing versions after 3.1.
After installation, you can start MLflow with the following command:
mlflow server --host 0.0.0.0 --port 5000Of course, I recommend starting the MLflow service using docker:
docker pull ghcr.io/mlflow/mlflow:v3.1.1
docker run -d --name mlflow-server \
-p 5000:5000 \
-v $(pwd)/mlruns:/mlflow/mlruns \
ghcr.io/mlflow/mlflow:v3.1.0 \
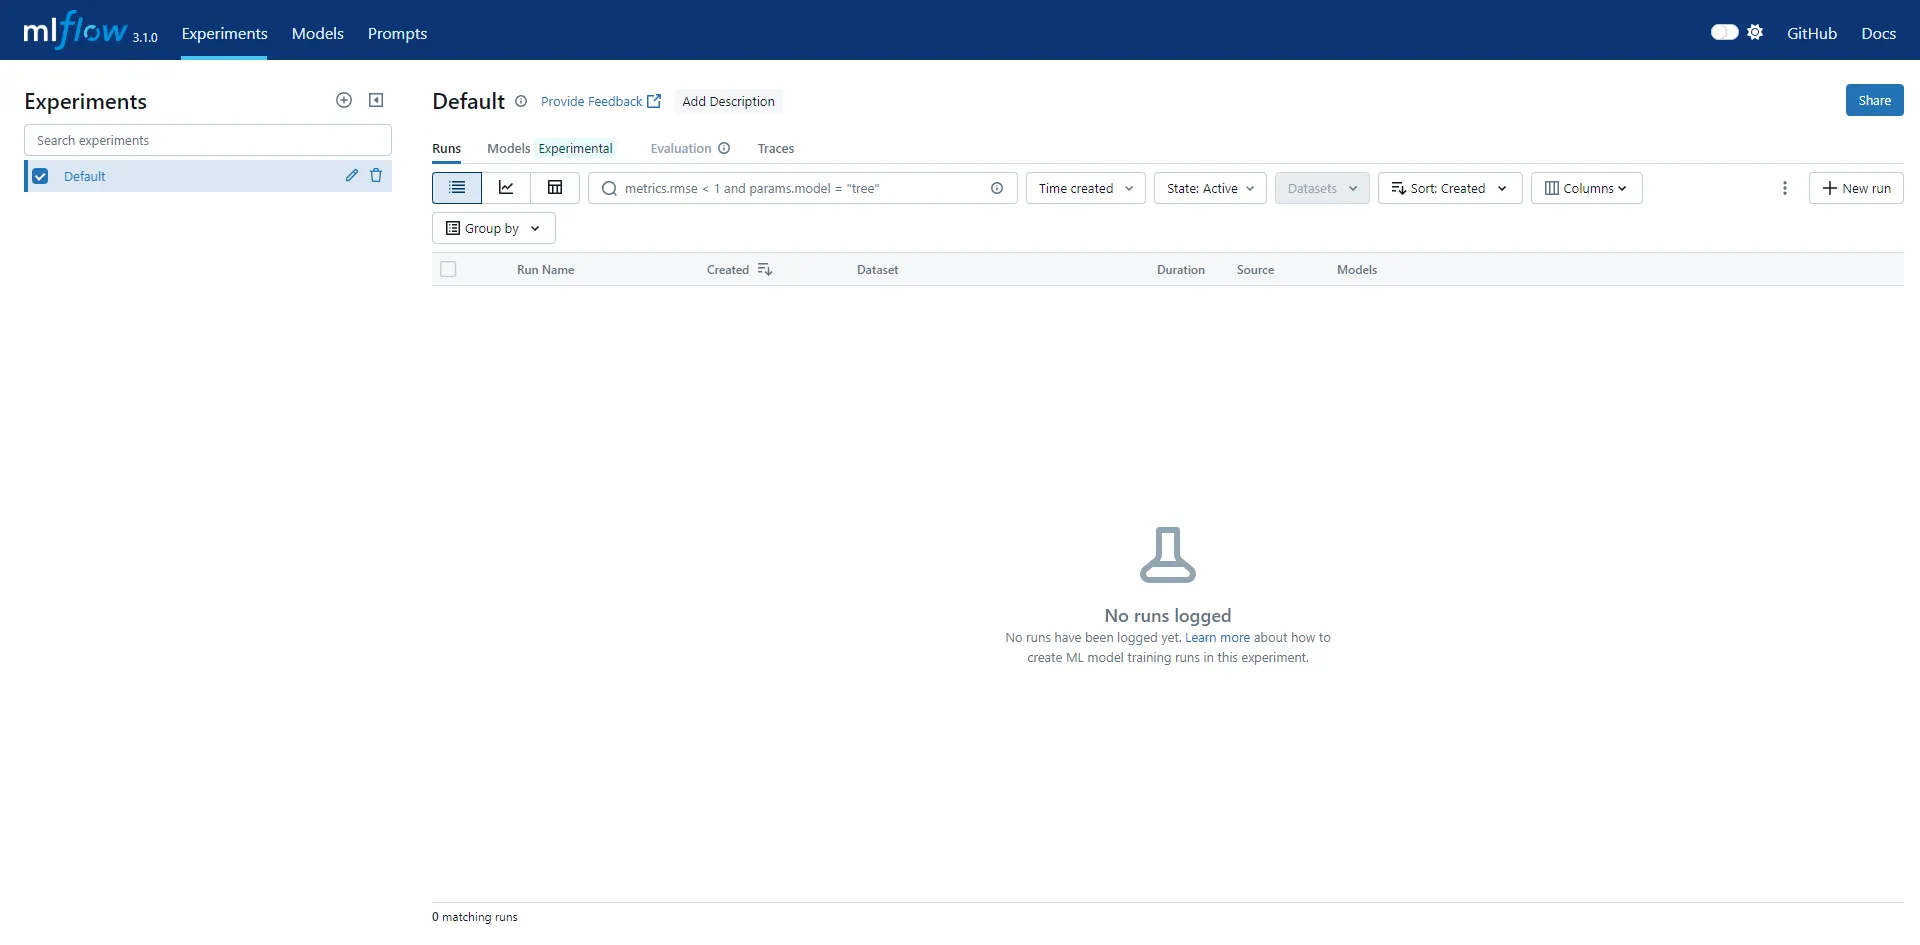
mlflow ui --host 0.0.0.0If you are installing in a development environment, simply use the mlflow ui command to start the server. At this point, you can access the MLflow UI interface via http://localhost:5000/:
Configure Client Code
Configuring MLflow's client is relatively straightforward. You can directly add the following code to connect:
mlflow.set_tracking_uri("http://localhost:5000")Of course, I recommend configuring via adding MLFLOW_TRACKING_URI in environment variables.
MLFLOW_TRACKING_URI=http://localhost:5000/After configuring both client and server, we can start using MLflow in your openai client code.
Track Your OpenAI Client Code with MLflow
Use Basic Annotation Method
Using MLflow is very simple; you only need one line of code to get started.
First, let's start with a basic OpenAI client API call:
mlflow.set_experiment("test_openai_tracing")

async_client = openai.AsyncOpenAI()

async def main(user_query: str) -> str:
    messages = [
        {"role": "system", "content": "You are a helpful assistant."},
        {"role": "user", "content": user_query},
    ]

    response = await async_client.chat.completions.create(
        model="qwen-plus-latest",
        temperature=0.7,
        messages=messages,
    )

    return response.choices[0].message.content
Next, we introduce mlflow and add the mlflow.trace annotation to the main method.
import mlflow

@mlflow.trace
async def main(user_query: str) -> str:
    ...
I suggest you set up an experiment. If you want to put all project tracking under the same experiment, you can also add a key in the environment variables:
MLFLOW_EXPERIMENT_NAME="test_openai_tracing"Don't forget to start your MLflow server first with mlflow ui. Then run the code and open MLflow's UI interface. At this point, we can see the previously tracked record.
Introduce UI Interface and Some Basic Concepts
Next, let's explain some basic concepts combined with the previous tracking:
If you open MLflow UI, the first thing displayed is the experiment we are tracking, such as the test_openai_tracing we just set in the code.
Select the experiment you want to view, click the Traces tab on the top right, and you can view all executed tracking records under the current experiment. You can tag each tracking record in code for easy filtering.
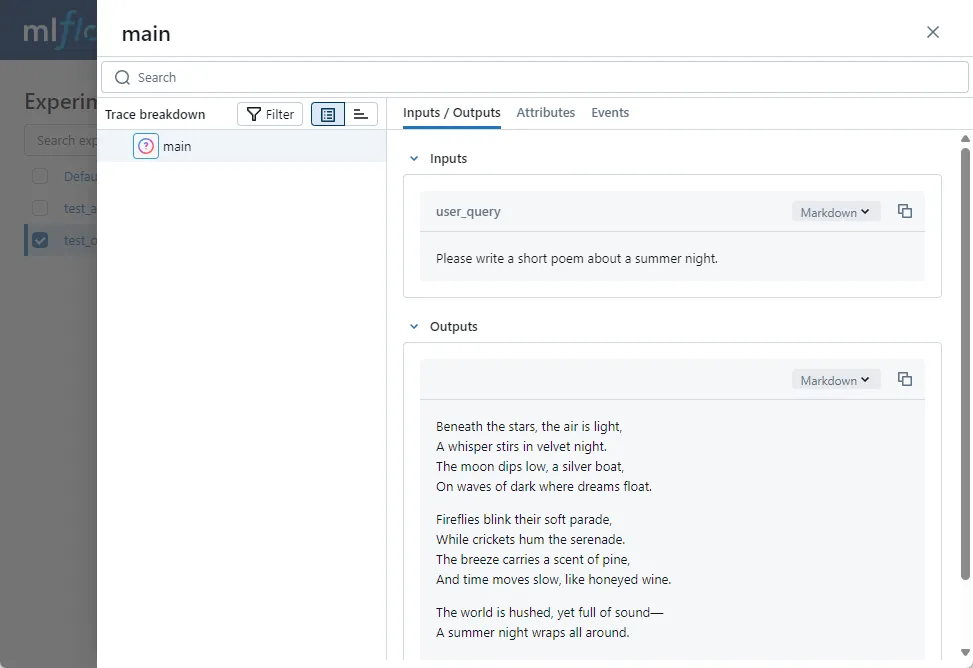
Click on the previously executed tracking record and open it, and we can see the detailed information included in this tracking:

The left side is a tracking event, which MLflow calls a Span. Since we used the annotation method on the main method, the span name here is main.
On the right are three tabs: Inputs/Outputs, Attributes, and Events.
Since we tracked the main method, Inputs/Outputs show the method’s inputs and outputs respectively. Later, if we track the OpenAI chat API, Inputs will display all parameters passed to the Qwen 3 LLM including messages. Outputs are the messages generated by the large language model.
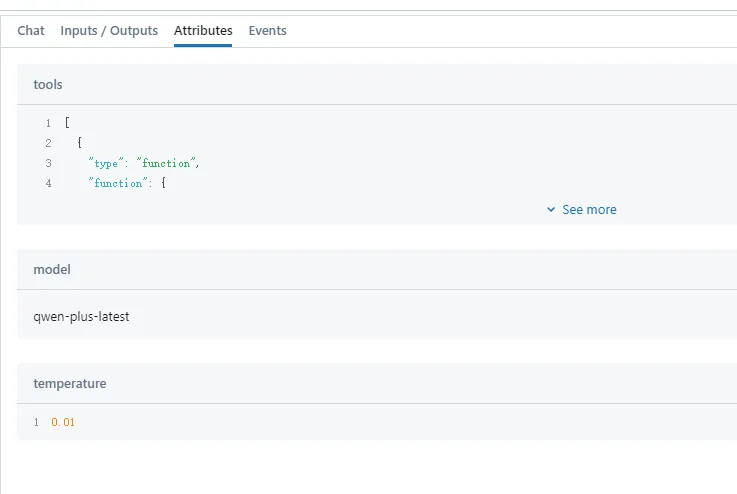
Attributes can record various custom attributes, and what to record is entirely up to you, helping us better document operational information.
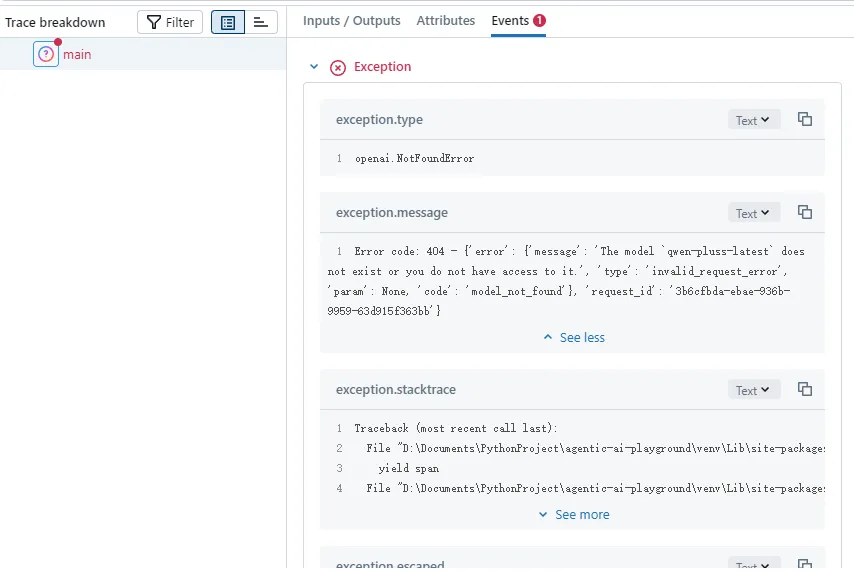
If exceptions are thrown during execution, they will be recorded in the Events tab. If you are calling streaming output, corresponding SSE messages will also be recorded here.
After explaining the UI interface, here is a brief introduction to some basic MLflow concepts:
To better organize tracking logs, MLflow's entire tracking system can be viewed as a tree structure.
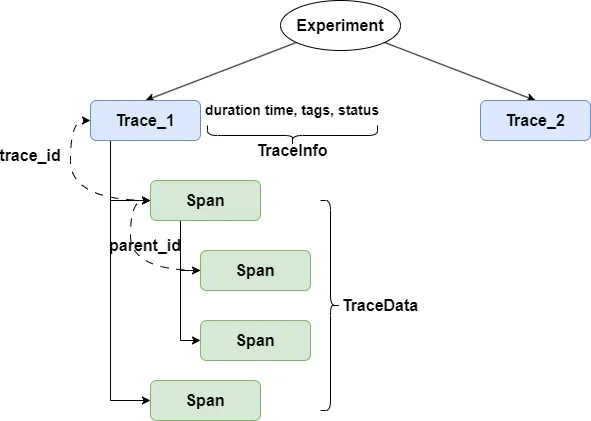
As shown in the previous code, the root nodes of tracking are individual experiments. You can put all tracking of a project into one experiment, or place different iterations of the project into separate experiments. It all depends on the size of your project and the granularity of tracking.
Next is trace, representing the tracking of a single code execution. You can consider trace as the entry point of this code execution.
A trace contains two independent data structures: TraceInfo and TraceData. TraceInfo includes duration time, tags, status, and other information to facilitate your filtering. TraceData is a collection of Spans.
What is Span? After enabling MLflow, you can allow different stages of each code execution to throw events. These events can represent either a method call, the execution of specific code blocks, or exceptions thrown. These events are different Spans.
Each Span has a trace_id, indicating which trace this Span belongs to. Spans also have parent-child relationships, with child Spans identifying their parent node through parent_id. For example, if your main method throws an event, and the main method calls the OpenAI create method which also throws an LLM event, the Spans corresponding to these two events form a parent-child relationship.
Each Span also has its own SpanType. For different SpanTypes, not only do they display different icons on the UI interface, but some special Spans also look significantly different on the right interface. For instance, LLM SpanType displays the context in a conversational way. Therefore, it is recommended to set different Types for different Spans to better observe program execution.
Use Autolog to Track LLM Calls
Earlier, we introduced how to use the mlflow.trace annotation to track application code. However, for agent development frameworks, or directly for OpenAI client code, this tracking method is not feasible because we cannot modify the framework source code. And if you add annotations to methods calling client APIs, you cannot finely record what parameters are passed to the API.
At this point, we can enable MLflow's autolog feature. Enabling this feature is also very simple; just add one line of code at the beginning of the program. For example, here we want to automatically track calls to the OpenAI API. So we enable OpenAI's autolog:
mlflow.openai.autolog()Note that since the principle of the autolog method is to monkey patch the original methods of the corresponding API, you need to ensure that the patched module is imported in advance. For example, you should import OpenAI before enabling OpenAI's autolog.
Next, let's demonstrate the autolog effect with a simple OpenAI client call:
@mlflow.trace(span_type=SpanType.CHAT_MODEL)
async def chatbot(user_query: str, messages: list[dict[str, str]]) -> str:
    messages.append({
        "role": "user",
        "content": user_query,
    })

    response = await async_client.chat.completions.create(
        model="qwen-turbo-latest",
        temperature=0.7,
        messages=messages,
        max_tokens=100,
    )

    llm_content = response.choices[0].message.content
    messages.append({
        "role": "assistant",
        "content": llm_content
    })

    return f"🤖Tony says: {truncate_str(llm_content)}"


@mlflow.trace(span_type=SpanType.CHAIN)
async def main():
    greetings = "Hello, what can I help you with today?"
    messages = [
        {"role": "system", "content": "You are Tony, a fun chatbot."},
        {"role": "assistant", "content": greetings},
    ]

    print(f"🤖Tony says: {greetings}")

    while True:
        user_query = input(">>> ")
        if "BYE" in user_query.upper():
            break

        tony_says = await chatbot(user_query, messages)
        print(tony_says)
In this example, we developed a simple chat program using the OpenAI native API. We added the mlflow.trace annotation to the main and chatbot methods.
Since this chatbot supports multi-turn conversations, each message sent to the LLM is assembled from historical chat context and the latest user input. Additionally, I truncated the text generated by the LLM in the program. This means that simply tracking the chatbot method, you fundamentally don't know what was input to the LLM or what was output.
Now, let's add the autolog code and rerun:
import mlflow
mlflow.set_experiment("test_openai_tracing")
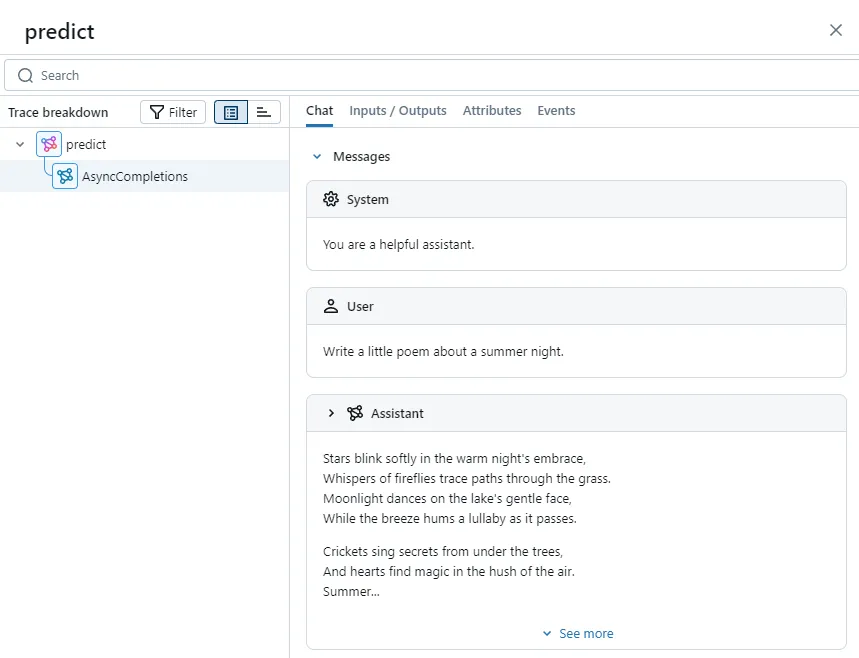
mlflow.openai.autolog()Open the UI interface and take a look. You will be pleasantly surprised to find that MLflow not only records the openai chat completion API call but also documents the entire conversation message in a dedicated interface:
Track Generator and LLM Streaming Output
Besides traditional method calls, in agent applications, we often face situations where we need to record LLM streaming output.
In the previous content, I mentioned that through the Events tab on the Span page, we can record SSE events obtained by the OpenAI API. Let's see how it's done. First, write a simple streaming output code:
mlflow.openai.autolog()

async def predict(query: str) -> AsyncGenerator[tuple[str, Any] | ChatCompletionChunk, None]:
    messages = [
        {"role": "system", "content": "You are a helpful assistant."},
        {"role": "user", "content": query}
    ]
    stream = await async_client.chat.completions.create(
        model="qwen-plus-latest",
        temperature=0.8,
        messages=messages,
        stream=True
    )
    async for chunk in stream:
        yield chunk
Next, let's go to the Events tab:
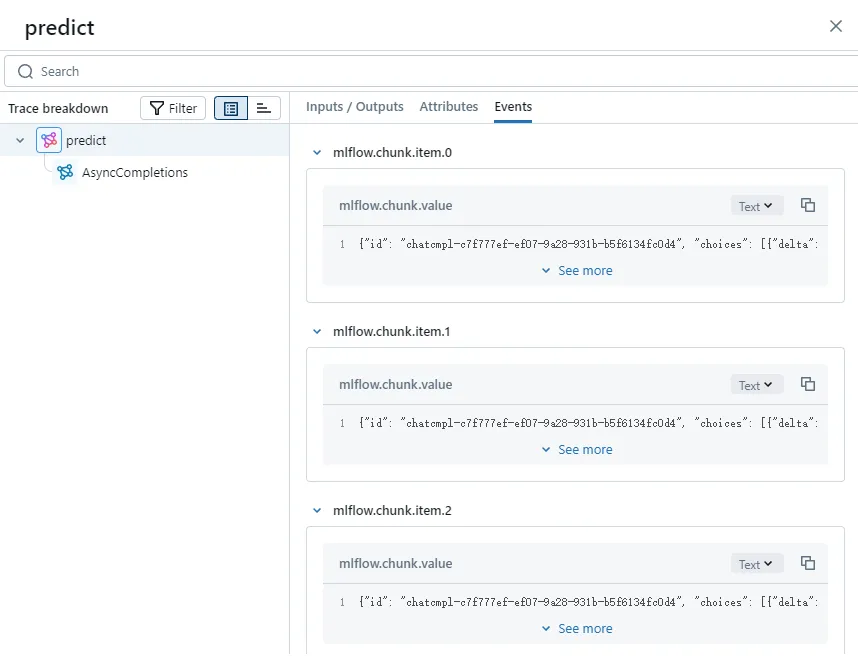
You can see that it lists each SSE message received by the client.
However, many times, we want to view the concatenated content of all SSE messages in the MLflow interface. Besides the OpenAI client, there are many other methods that also generate content as generators, requiring the generator output to be reduced into a complete message. At this point, the output_reducer parameter of mlflow.trace comes in handy.
Before using output_reducer, you need to create a reducer method. The method's parameter is the message generated by the generator, and the return value is the concatenated text or message:
def aggregate_chunks(outputs: list[ChatCompletionChunk]) -> str | None:
if not outputs:
return None
result = ""
for chunk in outputs:
result += chunk.choices[0].delta.content
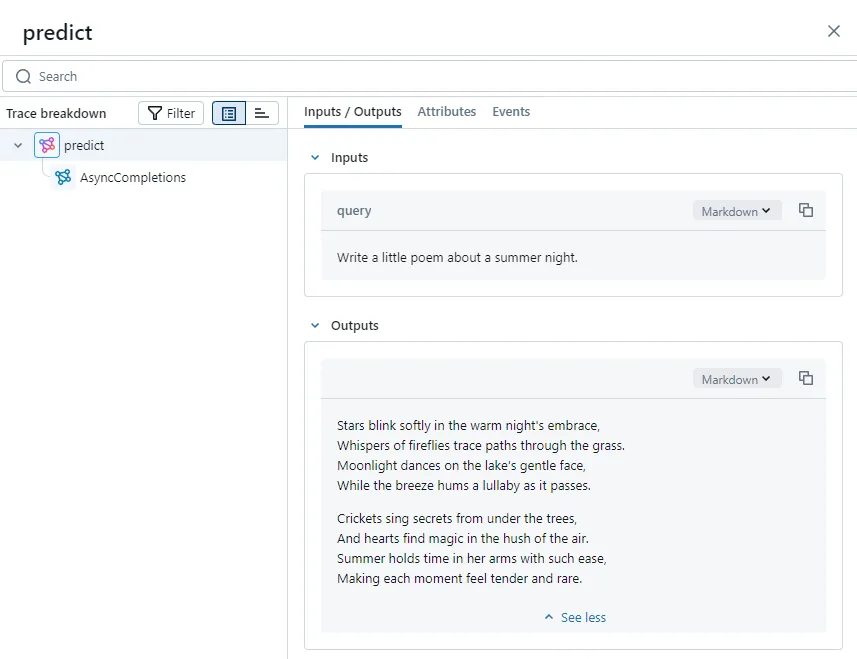
return resultThen, we only need to pass this method through the output_reducer parameter in mlflow.trace:
@mlflow.trace(span_type=SpanType.LLM, output_reducer=aggregate_chunks)
async def predict(query: str) -> AsyncGenerator[tuple[str, Any] | ChatCompletionChunk, None]:
    ...
Let's open the MLflow interface and take a look at the predict method's inputs and outputs. We can see that the LLM's streaming messages have been recorded as a fully concatenated text message:
Of course, if you enable OpenAI's autolog, MLflow will automatically concatenate SSE messages from the chat completion API:
But for generator methods, output_reducer is more versatile and allows customizing the concatenated message body. For details, refer to the official documentation.
Context Manager and Function Calling
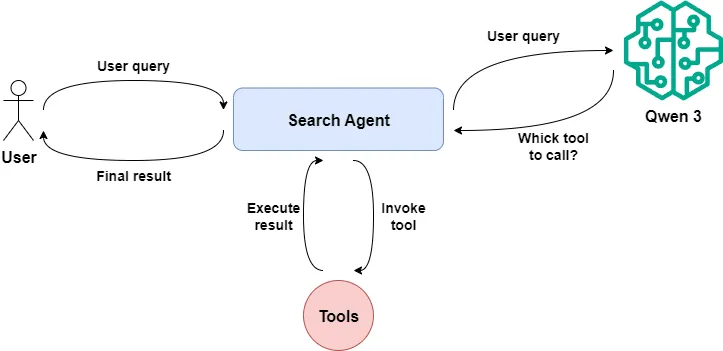
Finally, we will consider a more complex situation: if you develop an agent program, then the LLM will not only generate responses to user requests but also call specific tools based on user intent and rewrite the execution results before returning them to the user.
This process represents multi-step operations within an agent method. We cannot simply use mlflow.trace to record method calls, nor can we only use autolog to record OpenAI API calls.
At this point, we can use MLflow's context manager to record each step in the agent's running process separately with a Span. Meanwhile, intermediate outputs can be recorded in the Span's attributes, making it easier to track.
Next, let's simulate agent execution with a native OpenAI function calling.
First, we define a search_web method that takes user input as a parameter, uses the Tavily API to search the web, and returns search results:
@mlflow.trace(span_type=SpanType.TOOL)
async def search_web(query: str) -> str:
    web_client = AsyncTavilyClient()
    response = await web_client.search(query)
    return str(response["results"])
According to the OpenAI API documentation, we also need to convert the tool into a specific structured description:
tools = [{
    "type": "function",
    "function": {
        "name": "search_web",
        "description": "Find information on the web.",
        "parameters": {
            "type": "object",
            "properties": {
                "query": {
                    "type": "string",
                    "description": "What you want to search for."
                }
            },
            "required": ["query"]
        }
    }
}]

_tool_functions = {"search_web": search_web}
Then we define a call_llm method that calls Qwen 3, passes the message context and callable tools to Qwen, and waits for the model to return the corresponding message, which may contain tool_calls or the final result.
async def call_llm(messages: list[dict], tools: list[dict] | None = None) \
        -> ChatCompletionMessage:
    response = await async_client.chat.completions.create(
        model=MODEL_NAME,
        temperature=0.01,
        messages=messages,
        tools=tools,
    )
    return response.choices[0].message
Define a tool_invoke method. When the message returned by the LLM contains tool_calls, we use this method to call the corresponding tool to obtain results.
async def tool_invoke(message: ChatCompletionMessage, messages: list[dict]) -> list[dict]:
    result_messages = copy.deepcopy(messages)
    tool_calls = message.tool_calls
    for tool_call in tool_calls:
        function_name = tool_call.function.name
        tool_func = _tool_functions[function_name]
        args = json.loads(tool_call.function.arguments)
        tool_result = await tool_func(**args)
        result_messages.append({
            "role": "tool",
            "tool_call_id": tool_call.id,
            "content": tool_result,
        })
    return result_messages
Finally, the search_agent method acts as the agent, containing the call order of the preceding methods. We first implement the basic code logic without MLflow tracking.
@mlflow.trace(span_type=SpanType.AGENT)
async def search_agent(query: str) -> str:
    messages = [{
        "role": "system",
        "content": "You are a helpful assistant, and you use search_web tool to find information on the web.",
    }, {
        "role": "user",
        "content": query,
    }]

    message = await call_llm(messages, tools)

    if len(message.content) > 0:
        return message.content

    messages.append(message.model_dump())

    messages = await tool_invoke(message, messages)

    message = await call_llm(messages)

    return message.content
Executing the search_agent method shows that the agent searches the web and returns organized results based on our provided tasks:
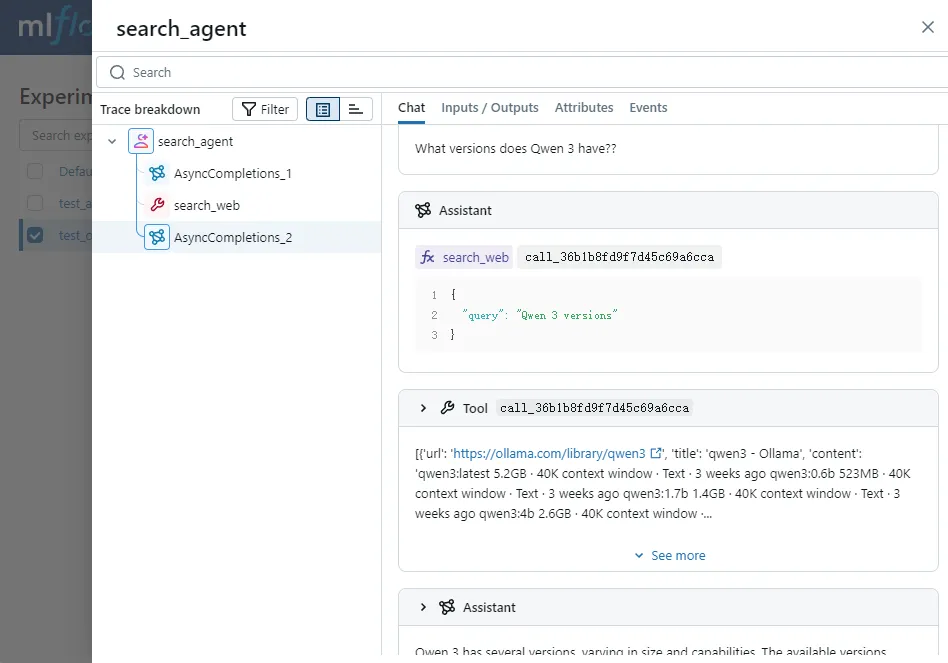
We summarize the several steps of executing the search_agent code: deciding which tool to call based on user requests, calling the specific tool, and generating corresponding output based on the tool's return.
Next, we use MLflow's context manager to track these three steps separately and additionally record the input and output data of each phase.
First, we add two tags to the current trace: the date of execution and the model name used during execution. This will facilitate subsequent trace filtering and quickly locate the desired records:
mlflow.update_current_trace(
tags={
"date": date.today().strftime("%Y%M%d"),
"model": MODEL_NAME
}
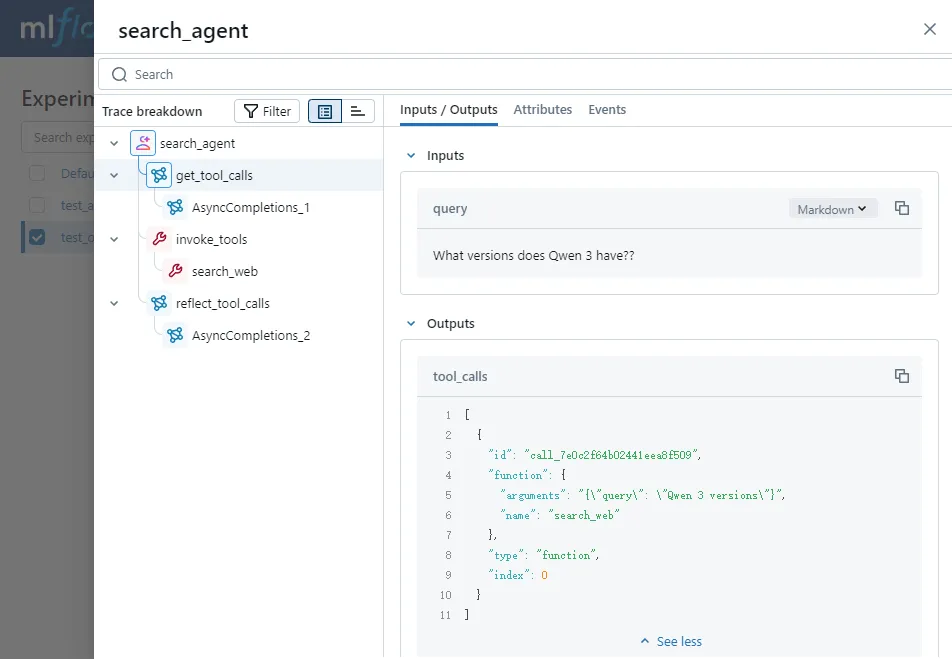
)Next, start defining the first Span, named get_tool_calls. Simultaneously, we record the user request and the model's returned message.content as Inputs/Outputs:
with mlflow.start_span(name="get_tool_calls", span_type=SpanType.LLM) as span:
    span.set_inputs({
        "query": query
    })
    messages = [{
        "role": "system",
        "content": "You are a helpful assistant, and you use search_web tool to find information on the web.",
    }, {
        "role": "user",
        "content": query,
    }]

    message = await call_llm(messages, tools)
    if len(message.content) > 0:
        span.set_outputs({
            "results": message.content
        })
        return message.content

    messages.append(message.model_dump())
    span.set_outputs({
        "tool_calls": message.tool_calls,
    })
    span.set_attributes({
        "num_of_tool_calls": len(message.tool_calls),
    })
Define another Span, recording the tool_calls and the results obtained from calling the tool as the Span's Inputs/Outputs:
with mlflow.start_span(name="invoke_tools", span_type=SpanType.TOOL) as span:
    span.set_inputs({
        "tool_calls": message.tool_calls
    })
    messages = await tool_invoke(message, messages)
    tool_call_results = messages[-1: -1 - len(message.tool_calls)]
    span.set_outputs({
        "tool_call_results": tool_call_results
    })
    span.set_attributes({
        "num_of_tool_call_results": len(tool_call_results),
    })
Finally, define a Span named reflect_tool_calls, recording the final copy generated by the large language model based on the tool's return results:
with mlflow.start_span(name="reflect_tool_calls", span_type=SpanType.LLM) as span:
    span.set_inputs({
        "messages": messages,
    })
    message = await call_llm(messages)
    span.set_outputs({
        "answer": message.content
    })
We check the effect of custom Spans through the MLflow interface. We can see that the parent Span and three custom Spans have been recorded. By clicking on each Span, we can see the complete execution process of the agent on the right, giving us a clear understanding, right?
So far, through a few simple OpenAI client practices, we have basically mastered the usage of MLflow.
However, in enterprise-level agent applications, we can't start from basic OpenAI code but use higher-abstraction agent frameworks to complete application development. So next, I will use Autogen's GraphFlow workflow application as an example to show you how to use MLflow for tracking and observing agent code in enterprise-level application scenarios.
Enhance Observability and Explainability of Autogen Agents with MLflow
Currently, my team is using Autogen to build enterprise-level agent applications. If you want to know how this happened, you can read my article:

In the following content, I will start from tracking a simple AssistantAgent and proceed to the practice of Autogen GraphFlow, showing you how we perform effect tracking in agent applications.
Fix MLflow 3.1 Bug in Autogen Autolog
Before we begin, it needs to be noted that Autogen officially provides a solution for tracking agent applications.
But if you follow the official tutorial to deploy the OpenTelemetry service, write the code, and execute it, you will get such an interface.
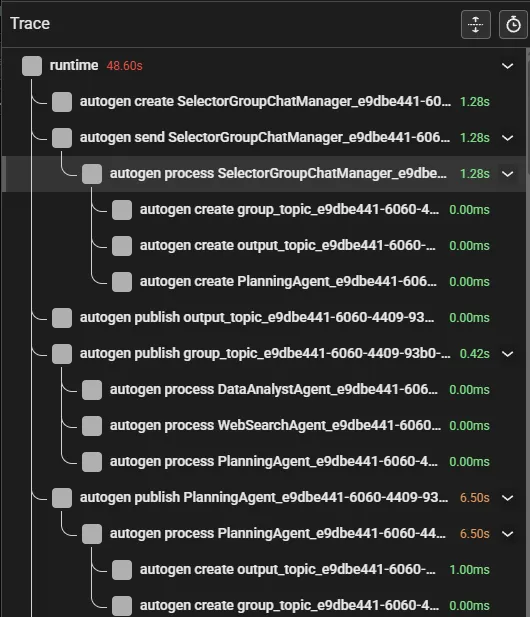
Clicking inside, you will see many Span-like structures but no useful information:
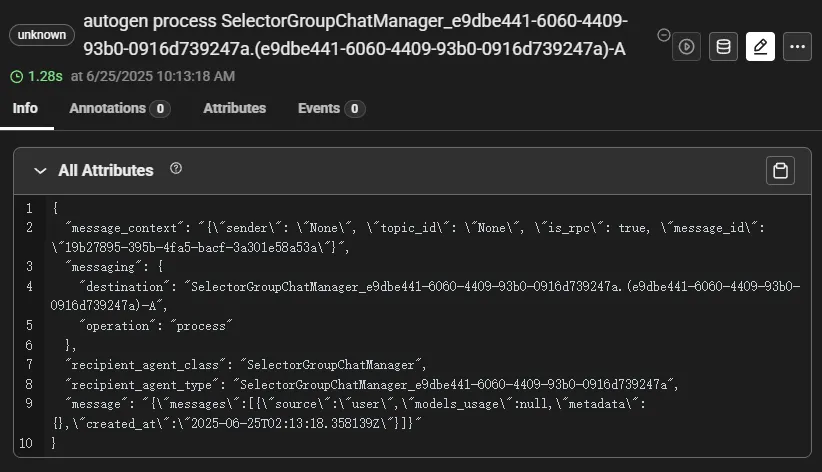
This is why we use MLflow instead of the official recommended solution today: we need an organized and clearly informative tracking tool.
In fact, MLflow also provides autolog for the Autogen framework. You only need to introduce one line of code to start tracking agent execution:
mlflow.autogen.autolog()Unfortunately, as of writing this article, using autolog to record agents with function calling in Autogen 0.6.1 version will result in the following error:
WARNING mlflow.utils.autologging_utils: Encountered unexpected error during autogen autologging: 2 validation errors for ChatMessage
content.str
  Input should be a valid string [type=string_type, input_value={'content': [{'content': ...ExecutionResultMessage'}, input_type=dict]
    For further information visit https://errors.pydantic.dev/2.11/v/string_type
content.list[tagged-union[TextContentPart,ImageContentPart,AudioContentPart]]
  Input should be a valid list [type=list_type, input_value={'content': [{'content': ...ExecutionResultMessage'}, input_type=dict]
    For further information visit https://errors.pydantic.dev/2.11/v/list_type
The reason for this error is that when MLflow monkey patches Autogen’s API and finds that the message type returned by the LLM call is FunctionExecutionResultMessage, it calls the message.model_dump() method to write into the ChatMessage's content attribute.
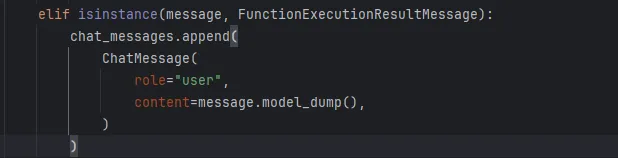
However, the content attribute only accepts values of type str and list, while the model_dump() method returns a dict type, thus causing validation errors.
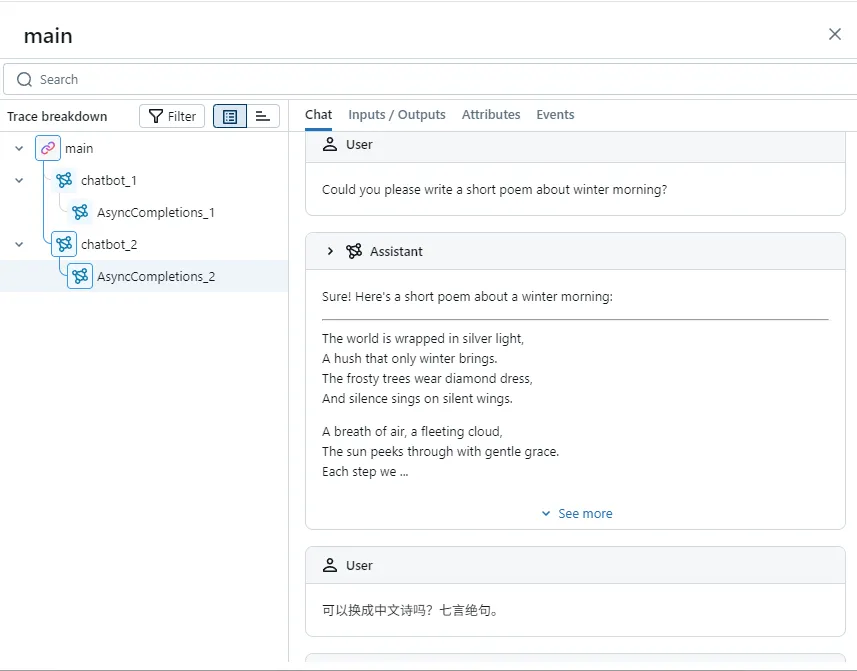
Therefore, before continuing to track Autogen applications, we need to fix this bug. Here is the tracking record after the fix:
As you can see, MLflow has well-recorded the execution steps of Autogen AssistantAgent, including detailed LLM inputs, outputs, and various parameters.
Let me explain how I fixed this bug.
Previously, we discussed that the reason for the Pydantic validation error was that the content attribute of ChatMessage did not accept dict type values. Therefore, we need to modify ChatMessage to support dict types for the content attribute.
Since ChatMessage is referenced by the mlflow.autogen.chat module, modifying it using subclasses is not feasible. A more viable approach is to monkey patch ChatMessage and then replace the reference in autogen autolog.
I will place the monkey patching code for ChatMessage in the autogen_patching.py file.
Since the original ChatMessage code and its calling code are dynamically loaded in the autolog method, before modifying the ChatMessage code, we need to load autolog first:
import mlflow


TARGET_MODULE = "mlflow.types.chat"
ORIGINAL_CLASS_NAME = "ChatMessage"
BASE_CLASS = "BaseModel"

mlflow.autogen.autolog()
Then, we re-implement the ChatMessage class and add dict type to the content attribute:
module = importlib.import_module(TARGET_MODULE)
BaseModel = getattr(module, ORIGINAL_CLASS_NAME)

class ChatMessage(BaseModel):
    role: str
    content: str | list | dict | None = None
With the help of DeepSeek R1, I wrote a utility for monkey patching ☺️:
class ClassReplacer:
    def __init__(
            self,
            target_module: str = TARGET_MODULE,
            original_class_name: str = ORIGINAL_CLASS_NAME,
            new_class: Type = None,
    ):
        self._target_module = target_module
        self._original_class_name = original_class_name
        self._new_class = new_class

        self._module = importlib.import_module(self._target_module)
        self._original_class = getattr(self._module, original_class_name)

    def apply(self):
        for mod_name, mod in list(sys.modules.items()):
            if mod is None or not isinstance(mod, ModuleType):
                continue

            if hasattr(mod, self._original_class_name):
                current_ref = getattr(mod, self._original_class_name)
                if current_ref is self._original_class:
                    setattr(mod, self._original_class_name, self._new_class)
In this tool, we first replace the original Class with the re-implemented Class, and then replace all references.
Introduce the written autogen_patching, and then run our Autogen agent code. Bingo, it runs normally now.
Project Practice: Tracking Autogen GraphFlow Application
Where MLflow truly shines is in AI applications based on multi-agent frameworks. Due to the high level of abstraction and flexible orchestration among agents in these applications, it is challenging to understand the execution order of various agents during actual code execution or what the final prompts fed into the LLM are in each step.
However, with the help of MLflow, all this becomes manageable. In the following simple project practice, I will directly use Autogen's official GraphFlow project example to demonstrate how to track and observe in multi-agent applications.
Additionally, with the assistance of MLflow, we will fix a hard-to-spot bug in the official example.
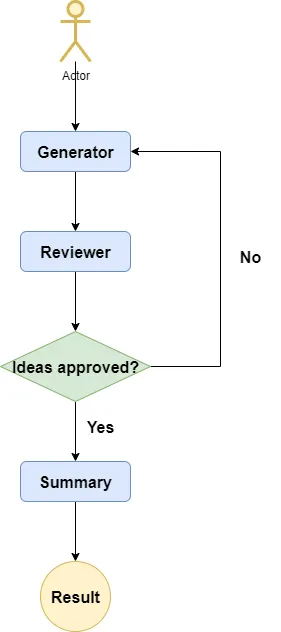
This is an idea generation workflow project containing generator, reviewer, and summary nodes. The generator generates a series of ideas based on user requests, the reviewer reviews the feasibility of these ideas and decides whether the generator needs to regenerate them, and the summary ultimately compiles the final summary. The flowchart of the entire project is as follows:
Then, we create three agents respectively.
Generator agent:
generator = AssistantAgent(
    "generator",
    model_client=model_client,
    system_message="""
    Generate a list of creative ideas.
    """
)
Reviewer agent:
reviewer = AssistantAgent(
    "reviewer",
    model_client=model_client,
    system_message="""
    Review ideas and provide feedbacks, or just 'APPROVE' for final approval.
    """
)
Summary agent:
summarizer_core = AssistantAgent(
    "summary",
    model_client=model_client,
    system_message="""
    Summarize the user request and the final feedback.
    """
)
I previously wrote an article discussing the issue of position bias caused by passing too many messages to the LLM, leading to poor generation quality due to the inability to understand user intent:

Autogen introduces a wrapper called MessageFilterAgent, which filters messages input to the wrapped agent, thereby avoiding position bias caused by inputting too many messages.
Take the following code as an example. Since the generator and reviewer agents engage in multiple rounds of discussion loops to reach a final conclusion, we only need to send the last message to the summary. Whether to filter the last message from the reviewer will be discussed later:
filtered_summarizer = MessageFilterAgent(
    name="summary",
    wrapped_agent=summarizer_core,
    filter=MessageFilterConfig(
        per_source=[
            PerSourceFilter(source="user", position="first", count=1),
            PerSourceFilter(source="reviewer", position="last", count=1),
        ]
    )
)
Finally, we use GraphFlow to integrate the above agent nodes into a DAG workflow structure:
builder = DiGraphBuilder()
builder.add_node(generator).add_node(reviewer).add_node(filtered_summarizer)
builder.add_edge(generator, reviewer)
builder.add_edge(reviewer, filtered_summarizer, condition=lambda msg: "APPROVE" in msg.to_model_text())
builder.add_edge(reviewer, generator, condition=lambda msg: "APPROVE" not in msg.to_model_text())
builder.set_entry_point(generator)
graph = builder.build()
flow = GraphFlow(
participants=builder.get_participants(),
graph=graph,
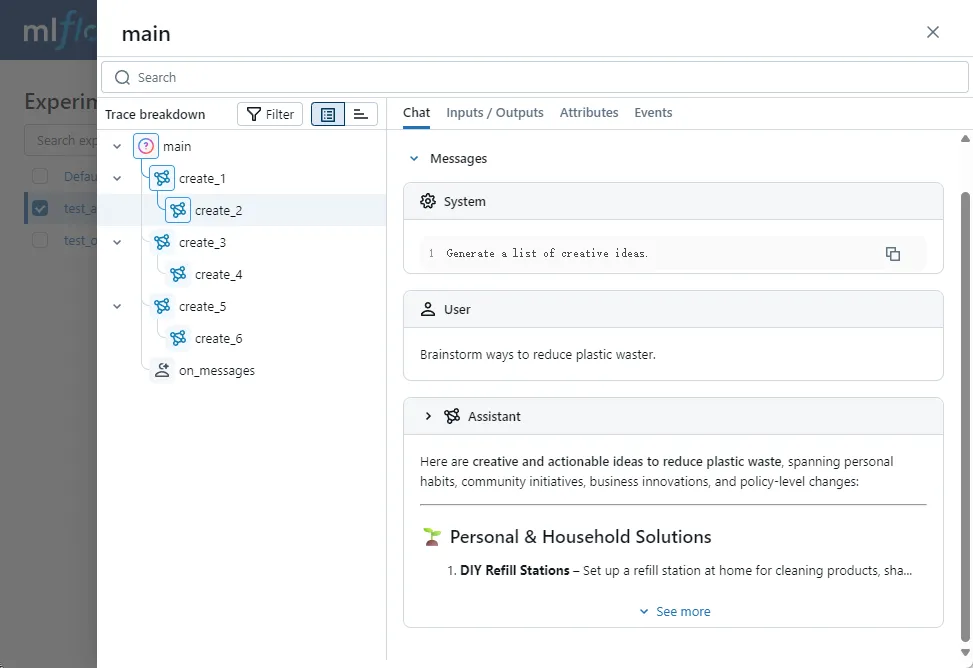
)Check the effect of the agent’s operation:
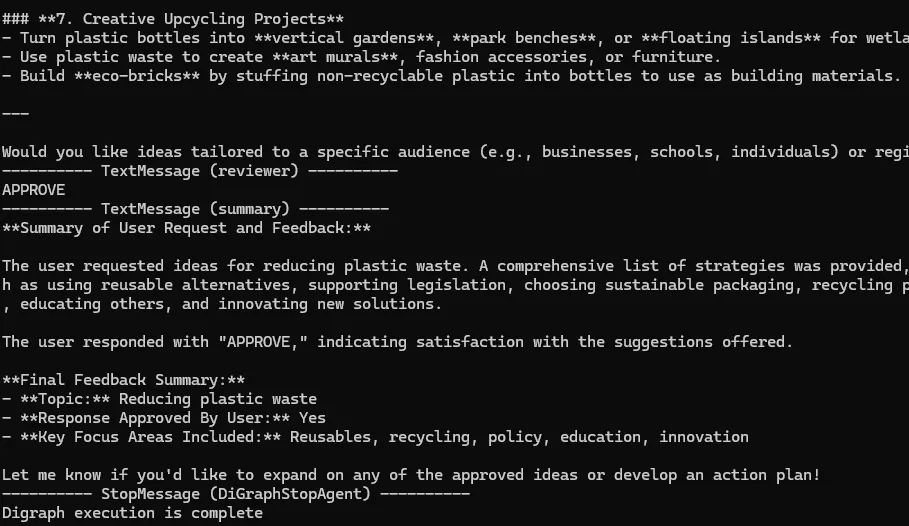
It seems the workflow ran normally, but it also appears it didn't. The summary agent outputs the final summary, yet it doesn’t seem to summarize any substantial content: Isn't this the norm in our daily development of agent applications? But it indeed doesn't meet the usability requirements of enterprise-grade GenAI applications.
Let's examine where the problem lies. Remember the modified autogen autolog script from earlier? Let's introduce it and rerun the entire application.
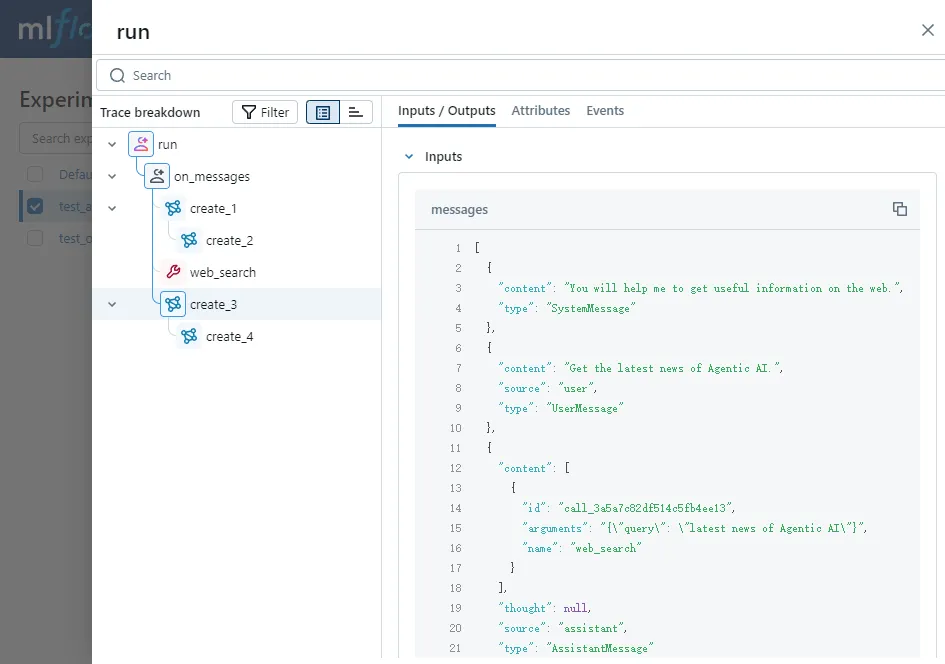
import utils.autogen_patchingThis time, let's observe what message the summary agent finally passed to the Qwen 3 model via the MLflow interface:
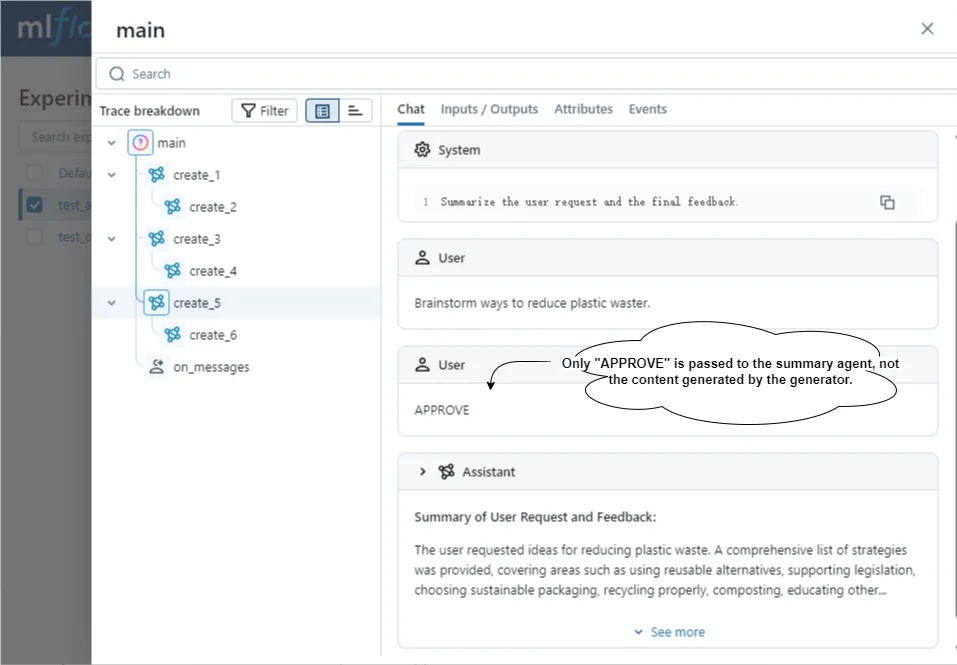
Did you spot the issue? We only passed the user's request and the APPROVE message generated by the reviewer agent to the large language model, without including the creative content generated by the generator agent.
This is because in the configuration of MessageFilterAgent, we indeed configured it to retain the first message from the user and the last message from the reviewer:
filtered_summarizer = MessageFilterAgent(
    name="summary",
    wrapped_agent=summarizer_core,
    filter=MessageFilterConfig(
        per_source=[
            PerSourceFilter(source="user", position="first", count=1),
            PerSourceFilter(source="reviewer", position="last", count=1),
        ]
    )
)
But what we really need is the last message generated by the generator, so we need to change the code to retain the last message generated by the generator:
filtered_summarizer = MessageFilterAgent(
    name="summary",
    wrapped_agent=summarizer_core,
    filter=MessageFilterConfig(
        per_source=[
            PerSourceFilter(source="user", position="first", count=1),
            PerSourceFilter(source="generator", position="last", count=1),
        ]
    )
)
Then run the code again, and observe the tracking interface:
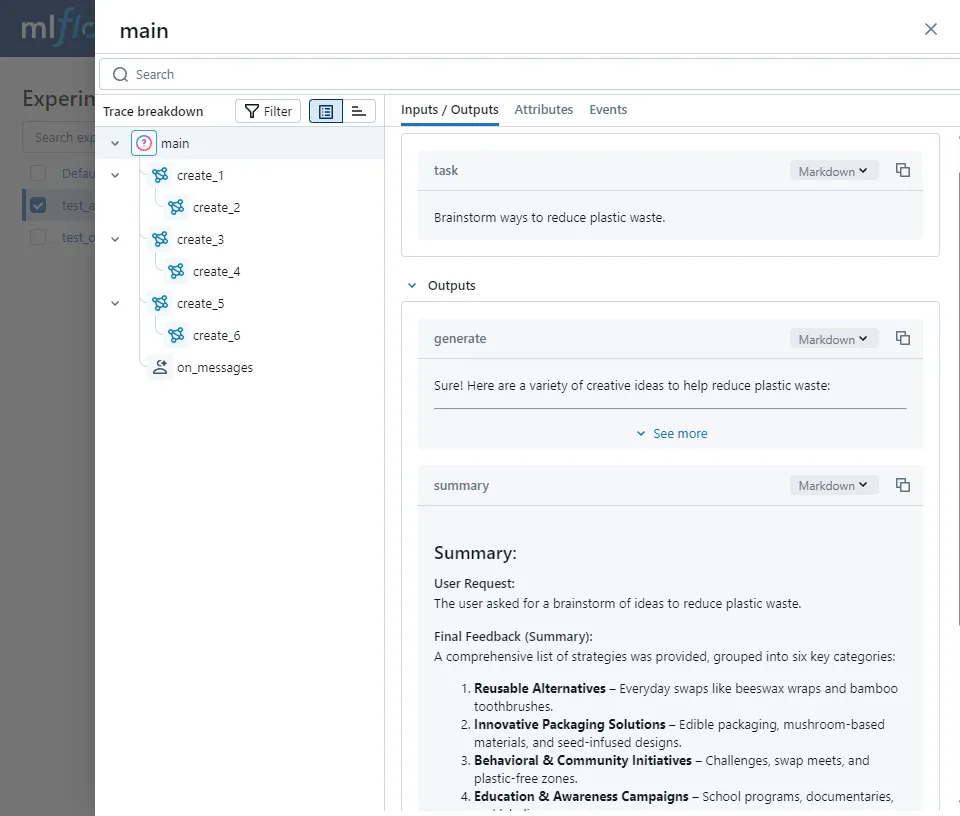
As you can see, this time the summary got the user's request and the final approved message from the generator, and generated a content-rich summary.
How about that? With the help of MLflow, problems that were originally hard to detect can now be clearly observed through the interface and resolved. MLflow once again proves its value!
Are we done? Hold on a bit longer.
Besides recording the input and output messages of large language models, to conveniently track logs of multiple agent executions and document performance, we need to record additional information.
We still use the context manager method to wrap the application execution code in the main method.
As usual, we first add date and model tags to the trace, making it easier to filter traces you focus on later:
mlflow.update_current_trace(
tags={
"date": date.today().strftime('%Y%m%d'),
"model": model_client_config.get('model'),
}
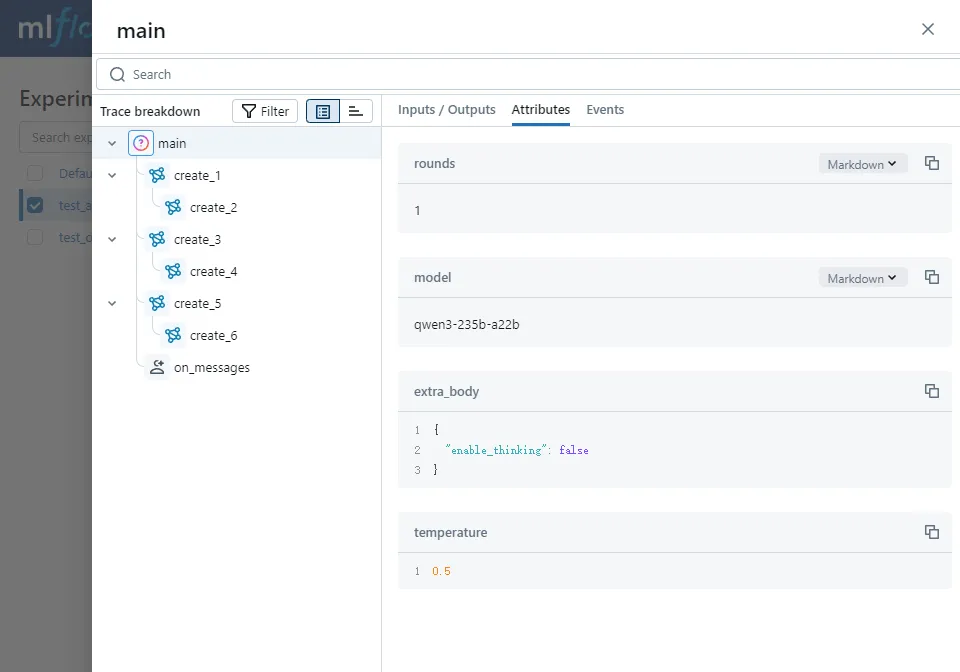
)As a measure of agent-generated performance, in this project, we are concerned with the number of cycles between the generator and reviewer. Fewer cycles indicate lower token usage costs, so we can record how many times the generator created and the corresponding large language model settings in the root Span:
generates = [msg for msg in result.messages if msg.source == "generator"]
final_generate = generates[-1]
summary = [msg for msg in result.messages if msg.source == "summary"][0]
current_span.set_outputs({
    "generate": final_generate.content,
    "summary": summary.content,
})
current_span.set_attributes({
    "rounds": str(len(generates)),
    **model_client_config,
})
OK, now open the MLflow interface again, and you can see the customized data just recorded. Of course, you can also add some tracking data according to your needs.
Thus far, I have explained how to conduct effect tracking and observation in Autogen multi-agent applications. Isn't it simple?
Conclusion
Today, we can learn multi-agent application development methods through various tutorials, but rarely do people discuss tracking and observation solutions for agent applications.
For enterprise-level intelligent applications, as the abstraction levels of various agent development frameworks become higher, using tools to enhance the observability, explainability, and traceability of applications is becoming increasingly important.
In today's article, I explained how to use MLflow 3.x version to track and observe agent applications, covering the use of annotations, autolog, and context managers, as well as a detailed tutorial on how to track Autogen GraphFlow.
In upcoming articles, I will continue to explain how to manage the effectiveness of different versions of prompts and how to evaluate the generation effects of agents. Stay tuned.
Thank you for subscribing. I hope my Agentic AI series tutorials make you feel they are worth more than their price. Feel free to leave comments for discussion, and I will reply as soon as possible.
Here is the source code for this article: